Archive for the ‘Gallup’ Category
McCain Wants Yet Another War; Maliki Should Hide In Shame, US War Ship To The Rescue
In Gallup, ISIS, John McCain, John McCain Jingoist, Maliki, MSNBC, Obama, Pew Research. Anti War dot com., US involvement in Iraq on June 14, 2014 at 11:44 PMFebruary Job Numbers And Unemployment Rate
In 2009 Stimulus, Benen Chart, Gallup, MSNBC, Steven Benen, The Pardu, The Rachel Maddow Blog, US GDP, Yahoo Finance, YCharts on March 7, 2014 at 4:52 PMThe February Unemployment report has been released. Unemployment ticked up by .1 percent from 6.6 to 6.7 percent. The Department of Labor (DOL) reported job creation hit 175,000; beyond expectation. The DOL also reported the job numbers for January and February were adjusted, as is always the case. The February jobs number is a bit of a surprise, especially after all the talk about how the polar vortex (for us high information people) may have influenced 2014 employment figures.
Let’s run through a quick set of visuals.
Steven Benen, The Rachel Maddow Blog
Benen Chart I
The following Benen chart has a notation added by The Pardu.
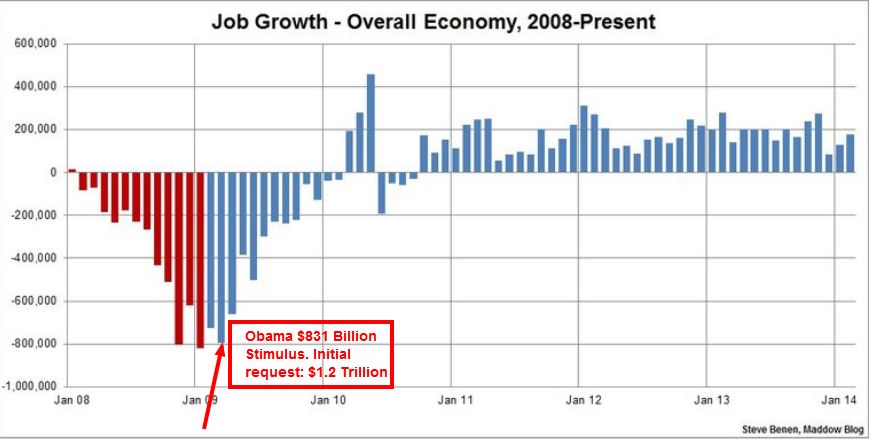
The open-minded must wonder how our jobs numbers and unemployment rates would look, if the GOP have given the Obama Team the full $1.2 Trillion requests in early 2009. Alas, a wonderment that is best left for the reality of GOP obstruction as never before in US History. Obstruction that places the nation’s economic health as secondary or tertiary consideration after political maneuvers and subservience to the whims of uber wealthy money-backers (e.g. the Koch brothers cabal, Adelsen and other less public plutocrats).
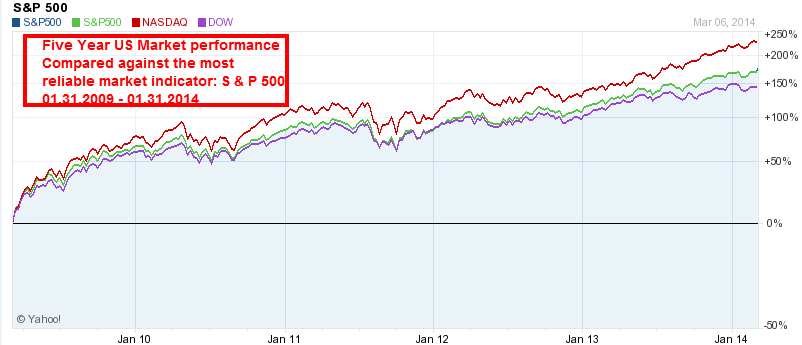
Benen Chart II

Yahoo Finance
YCharts
Key Economic Indicators (Individual Indicators linked, here.)
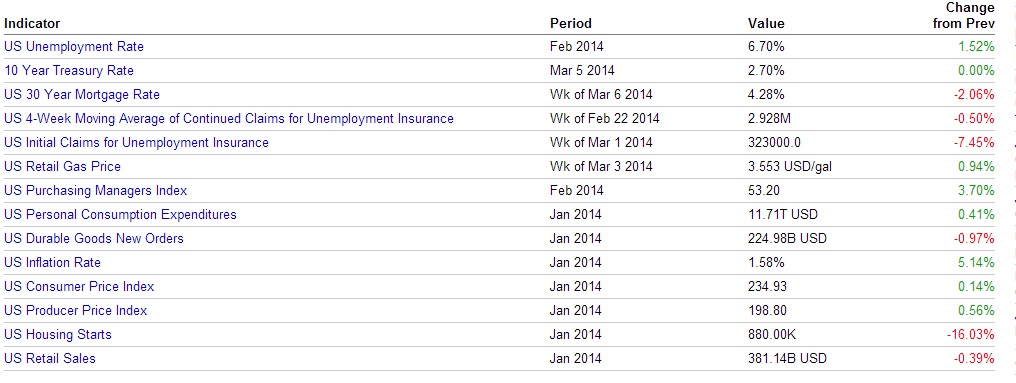
Gallup self-reported daily spending, here.
The economy continues to improve at a slow but steady past.
It is critical to remind you that we are seeing continuous improvement sine the 2009 Stimulus unabetted despite irrefutable GOP obstruction. If the six million people denied unemployment payments were granted life sustaining assistance, we would have millions more spending towards the US GDP; people who are forced to live off unemployment payments spend the money. There is no money for market investment, savings, and nor discretionary spending. They damned sure cannot send money to offshore accounts то avoid US taxes.
Koched: The US Senate Has A Koch Coming! You May Provide The Bottle Opener
In Gallup, Kochs, Obama, Tea Party, US Congress, US Senate on February 7, 2014 at 10:40 AM |
| Does this item read Year 2002? Have we been hoodwinked? |
Two brothers are seeking to buy the US Senate! The brothers are singularly responsible for your tea party infested House of Representatives. The nation is being “Koched.” Of course, you know that means this:
|
Gallup December 2013
   |
It looks as if something pestiferous hit the US congress in the around the 2000 change of the decade. Despite occasional spikes to the positive, it seems the slide as been as consistent as the nations largest water slide. In 2010, the water slide appears to have turned into a 120 degree drop of a roller coaster. Yes, the Koch House, has driven the US Legislature into a personal governing body that is changing the face of our nation. Changes you will eventually feel as may are feeling today.
The Koch brothers have bought the US House of Representatives and they now have their sights on the US Senate. Once, they own the legislature, they actually wield much more power than any elected president. They become a ruling body off the power of their money to members of the legislature. We can only hope the money is for campaign purposes only, although we suspect the worse.
If you recognize the deleterious affect of the Tea Party on federal governance, you should know the Koch’s gave birth to ideology eventually named “Tea Party” many years ago. Fire Dog Lakes’s Kevin Grandia published a piece in February 2013 that provides background for the genesis of the current 9% rating for the US Congress: “New Study Finds Koch Bros. Tried to Start Tea Party Movement in 2002.”
‘To quarterback behind the scenes, third party efforts’: the tobacco industry and the Tea Party,‘ shows that the group Citizens for a Sound Economy launched a Tea Party movement website,www.us teaparty.com, that went live in 2002.
According to the website DeSmogBlog.com, who broke this story earlier today, CSE was founded in 1984 by the infamous Koch Brothers, David and Charles Koch in 1984. David Koch sat on the board of CSE for many years and the group’s first president, Richard Fink, went on to become a senior VP at Koch Industries.
The common public understanding of the origins of the Tea Party is that it is a popular grassroots uprising that began with anti-tax protests in 2009.
You can find a screenshot here of the archived U.S. Tea Party site, as it appeared online on Sept. 13, 2002.
The site is described as, “In 2002, our U.S. Tea Party is a national event, hosted continuously online, and open to all Americans who feel our taxes are too high and the tax code is too complicated.” There is also “Patriot Guest book” available for visitors to voice their support and write a message for CSE and the U.S. Tea Party movement.
Since, you know these things about the US House (and Tea Party anarchist in the US Senate)….
I. US Sequester
II. Federal Government ‘shutdown” (well planned, and enacted by the Right)
III. Unemployment Insurance benefits as a bargaining chip since President Obama took office in 2009.
IV. Cuts to SNAP benefits (Children the poor, elderly and in some cases active military families)
V. Cuts and refusals to increase security budgets for US Embassies worldwide (Benghazi)
VI. Voted down abuse of women legislation
VII. Voted as a block against gender pay issues in the workplace
VIII. House leadership ignores 91% public sentiment for weapons purchase background checks.
IX. Votes against repeal of DADT
X. Perpetrated battles against debt ceiling increase for the first time in US History (against Obama)
.….. you should pay close attention to the following segment from last night’s (Feb. 6th, 2013) ALL IN, Chris Hayes.
The list could go on and on!
http://on.msnbc.com/1lEA22v

Source documents
Think Progress (Climate Progress)
Paul Ryan Snuggles Up To His "Indispensable" Tea Party
In Barack H. Obama, Gallup, GOP, GOTP, Paul Ryan, Tea Party on December 17, 2013 at 3:37 PM
Paul Ryan and Patty Murray recently visited with David “lean Right” Gregory. The link below doesn’t represent the complete interview; we are focusing on the 3:00 minute link with Paul Ryan to illustrate a point. Ryan is the classic bullshit artist and has proven not one word from his mouth can be taken as credible. He is manipulative and I suspect deep-down Patty Murray, despite her words of “liking him,” is ultra cautious in dealing with the man. You only have to think back to his lies about completing a marathon in record time (Only to be busted by a relative) and his photo and video op fake soup kitchen visit during the 2012 campaign. The man literally took his wife and kids into a soup kitchen to feigned assisting the humane mission of the kitchen. They grabbed-up already clean pots and pans and faked clean those utensils through the shoot.
While not the most important video in this piece, the three minute video will give you sense of how a Ryan operates. In fact, if Gregory were inclined, he could have managed the three minutes for more productively. His interview with the Democrat Murray and the Republican Ryan are (for the TPI) preludes to the Chris Wallace Fox News interview of this past Sunday. Of course, we know Murray also spoke during the Gregory interview. We do not see the need for adding another video as she is not the focus of this piece.
This past Sunday Chris Wallace and his production team invited Paul Ryan and Patty Murray to his Fox News set. Murray declined to attend. Of course, Ryan sat for the interview in the complete sanctity of the perfect news setting: Fox News and Chris Wallace. While he spoke like a non-stop machine-gun about budget issues from a GOP perspective, our focus is on his comments about the tea party.
The following is a quick reference to the Wallace interview and Ryan’s political savvy in snugging up to the tea party.
“I think these groups are valuable. They’re part of our conservative family. I’d prefer to keep these conversations within our family.”
He thinks these groups are indispensable! A couple of questions are in order.
Beyond an infestation via the 2010 mid-terms and in part brought on by the election of Barack H. Obama in 2008 plus obscene levels of political contribution from the Right (Kochs et al), how is the Tea Party in congress “indispensable?” While there are many examples of how the Tea Party has contributed to the lowest approval ratings of any Congress in US History, we have a recent example of a $24 billion hit to the US GDP via the Tea Party (GOP) government shutdown.
First, lets review a bit of Gallup poll data that initiates concerns about Paul Ryan’s perceptions in life, personal insensitivity and his motives. If you think his proclamations of repudiation of Ayn Rand’s elitism and “power to the powerful” during the 2012 was sincere, you also may feel he actually ran that record marathon.

While neither party looks good, there is a noticeable trend in the following Gallup table.


Before we move-on and to placate those who are now thinking the president’s ratings as also down...agreed and duly noted.
We believe all aforementioned ratings are down in a major way due to the tea party infestation of both houses of Congress with a particular stench in the House of OZ. And, yes the NSA issues, false alarm IRS issues and “You can keep you policy,”‘ have worn on the president’s ratings. But, let there be no doubt tea party induced division in Washington DC also weigh heavily on the president’s ratings.
Ryan reaches across the GOP divide to massage the ego of the Tea Party. He feels “they are indispensable.” Is Ryan saying he is accepting of all things tea party? Some will say, “no” he meant the tea party in Congress. We posit the tea party in congress are elected officials earning $174,500 per year (of our tax dollars) who actually are not very different than what follows. They are certainly not standing-up against the images you are about to see, thus they are enablers.
Let’s look at a few examples of the tea party, and yes you have seen each example before.
Let’s look at a few examples of the tea party, and yes you have seen each example before.


You might say images posted above are extreme examples and are not indicative of the tea party. We suggest you know better.
You’ve seen all of those “low intellect” manifestations from the Tea Party, correct? How about a much more recent exhibition from a tea party group in Florida. A group that has worked to cloak itself from its public past. If want to see the more recent exhibit from the Tea Party, look closely at the following image apparently borrowed from some sick video game.
Keep in mind the group we reference issued the following statement to a Palm Beach, FL newspaper.
MSNBC Adam Serwer
Keep in mind the group we reference issued the following statement to a Palm Beach, FL newspaper.
MSNBC Adam Serwer
The National Liberty Federation, formerly known as the South Florida Tea Party, changed its name last January as part of a rebranding effort in the aftermath of President Obama’s reelection. The group’s founder, Everett Dickinson, told the Palm Beach Post that the group “wanted to differentiate ourselves from certain organizations that have the name ‘tea party’ and we can’t control.

The video game, Bioshock Infinite, takes place largely in a floating city called Columbia and depicts a racist, xenophobic society where people worship the American founding fathers as religious figures. The image posted to the National Liberty Federation’s Facebook page is of an in-game mural that depicts George Washington bathed in angelic light as he holds the Liberty Bell in one hand and the Ten Commandments in the other, as racist carictures of minorities gather at his feet. The banner at the bottom of the image says, “It is our holy duty to guard against the foreign hordes.
After the image was discovered on the Tea party group’s Facebook page it was taken down, and Serwer reports the group changed its privacy settings. How is such child-like actions any different than working in a grocery story, as a magistrate, or as a sheriff all day and adorning a Ku Klux Klan robe and hood in the evening to harass innocents? Scrubbing and cleansing one’s actions generally denotes there is something to hide. Cloaking is no good if the roots and hearts are not cleansed.
Such cleansing reminds of the recent Megyn Kelly and Fox News foray into the racial makeup of a (mystical, spiritual and non-existent) Santa and Jesus Christ. When caught with their butts hanging over a cliff, what did they do? They feigned media harassment of the “powerful” Fox News Network and laid their racism to speaking to (phantom) kids about Santa. Do you think the word “powerful” was scripted for Kelly’s reading? We believe the word was handed-off for reading to tickle the innards of Fox New sycophants.
Read more from Adam Serwer
Ryan’s remarks once more, for full effect.
Talking Points Memo…
I think these groups are valuable,” he said on “Fox News Sunday.””They’re part of our conservative family. I’d prefer to keep these conversations within our family.”
Ryan did say that he was not pleased that groups opposed the deal so quickly, but still said that the Tea Party is valuable.
“John was frustrated because they came out against our agreement before we even reached an agreement,” he said. “I was frustrated as well. But I see the Tea Party as indispensable.“
“John was frustrated?” We feel Boehner’s little exhibition was also scripted.
http://www.youtube.com/watch?….
http://www.youtube.com/watch?….
Ryan’s comments were obviously crafted and delivered to the Fox News audience as effectively as a political speech. President Obama does it all the time, correct?
The problem is GOP shortsightedness and desperation will catch-up with Ryan’s statements. The only real issue is how long it will take for the House Budget Chair to rile his anti-government cohorts. Maybe, it will last as long as the marionette master Kochs will allow the House contingent to remain quiet regrading budget issues.
We can rest assured that will not last very long.
The US Economy And Pew Research…Is Obama Derangement Working?
In Gallup, Pew Research, Stimulus on November 9, 2013 at 6:35 PM
Life for the 44th US President is never blasé.
A recent Pew Research survey shows the president’s approval rating dropped to the lowest levels since his 2009 first term inauguration. In some categories the ratings are no surprise, in other categories we have a clear case of either faulty polling, or a poll respondent group influenced by “….what was on the news today,” coupled with “I watch Fox News and CNN.” Yet, Pew shows the survey respondents span the political spectrum (Republicans, Democrats and Independents) and generally responded negatively with the greatest dissatisfaction among Independents.
Before we go to Pew, we have embedded a video segment from MSNBC’s Al Sharpton’s Politics Nation. While the political Right often refers to President Obama as a socialist, the US economy proves right-wing mantra is pure propaganda. Propaganda that in many cases works and works well. The following segment is a bit long for most. We have posted the segment based on the first half of the segment and its focus on the improving US economy. The second half of the segment may be of less interest as it is comprised of panel opining. Our intent in posting the video is also to show pathetic sadness related to people who suffer from right-wing politics and social insensitivity.
A look at Pew….


End Pew Data
___________________
Basically, it appears Independents are not happy with President Obama as survey data indicates. While, not part of the survey, we have to wonder about the extent of “washback” from the NSA/CIA disclosures. We also notice that Immigration is an area of malcontent.
More after the break below
More after the break below
Now, what is up with that? Are Independents holding the president responsible for GOP immigration obstruction? Or, is the president catching hell for not simply plowing over the GOP via moving immigration reform at a much faster pace?
We also notice a good degree of “what have you done for me lately” regarding the economy. Maybe, we at the TPI are naive to believe that presidents in and of themselves do not literally create jobs. We cannot get past positive private sector job improvement and we remember the harsh, harsh reality of the Bush economy on the public sector and the impact of GOP congressional obstruction in working to provide jobs. Therefore, our thoughts on the economy is admittedly jaded.
Of course, at the top of the Pew results (above) healthcare reform is an anvil that is probably deserving based on poor project management and insurance provider acumen at “playing the system.”
“Project management deserving?”
Yes, while the president did not have direct responsibility for management of the enormous IT website project, President Obama has accepted ultimate “buck stops here” responsibility. While, an item for another post, we will state the ACA website flop reflects negatively on the Fed procurement and contract award process. The White House and HHS must have suffered a major internal lack of understanding of project needs. Of course, we should also factor-in GOP obstruction, as states that refused to setup ACA Exchanges must be held culpable.
Again items for another screed, and all said Obama has publicly accepted full responsibility via his late week public interview with MSNBC’s Chuck Todd.
Anyone who feels the president intentionally mislead (“lied”) about “keeping your coverage” probably also believes the president was not born in Hawaii. His misstatements were probably an indication of problems to come regarding the grandiose scope of the project. We believe he also seriously underestimated “big insurance” greed and historic disregard from those who hold their policies. If you ignore those who hold “junk policies” with the hope and a prayer of never needing the policy, you are not one who will never find value in the ACA.
Let’s move to a critical Pew Research survey category that induces both frowns and wonderment about the motives of respondents. As stated before, we wonder about factors people may have considered that were outside the scope of survey questions.
Of the two thousand respondents 65% indicated an unfavorable response about the economy. A mere 35% approved of the presidents handling of the US economy.
We will explain insertion of the following chart via discussion of Jobs as the basis and impetus for a healthy economy.

How many times have you heard President Obama referred to as a “socialist?” How about the number of times you have heard members of the GOP and conservative pundits comment about, “The horrific US economy?”
The following Facebook meme shows a definite contrast from the Bush final year in office. The meme does not indicate (label) the Obama Administration American Recovery and Reinvestment Act (Stimulus) in late February and early March of 2009.

https://www.facebook.com/photo
The US economy certainly has a lingering negative impact on millions. There is no solace in presenting record market indicators and slowly improving GDP, when millions are out of work or suffering from lower wages (and soon to come cuts in supplemental nutrition assistance benefits). However, the middle and lower income strata will only find economic relief with an improved macro economy. We do not in any way subscribe to fail trickle-down/supply side economics, but we certainly believe the tree can only exist if the upper branches and fauna feed the tree trunk and roots. Economic improvement since the dead leaves and branches of the Bush years is well noted and welcomed.
The US economy is factually improving.
Improvement, however, is not generally shared among people who do not seek information to anchor thought and opinion. Gallup recently (September 2013) published a piece about Consumer Confidence.
We have no economist on staff for consultation on economic issues. Yet, we feel comfortable in our posit that the economy runs off jobs and productivity. Despite advances in technology, productivity is still dependent on jobs. Moreover, capitalism relies on people spending and jobs also drives one’s ability to spend. Job growth in the private sector ha been steady, but certainly not robust. Steady growth is a far better experience than the dismal reality of public sector employment.
The administration cannot pass legislation that would support improvements in public sector jobs. If public sector employment was reporting numbers at a fraction of private sector job numbers, the US economy would show performance at a moderately higher level. How can an Administration impact public sector employment without legislation from the US House and state legislators (many of which are run by republicans)?
A Manufacturers Alliance for Productivity and Innovation (MAPI) report from September 2013 is laden with data for the novice, but the report includes cautious optimism regarding manufacturing productivity with an assumption of “no federal government shutdown”.
|
Excerpt (highlight added by The Pardu
|
According to the housing is on a steady upward trend. We concede interest rate creep is affecting housing sales and possible a more critical index of housing starts, we do not find dire reports nor dire prediction about housing.
Bloomberg reported in September foreclosures were down 34% over the preceding eight year period. We also have seen data indicating home prices are rising.
As an indicator of an ailing economy we certainly cannot consider the auto industry. The industry is performing well. An industry completely abandoned by the GOP after the GOP/Bush economic collapse. Imagine the state of the economy and unemployment without a Chrysler or General Motors? Notice the top four on the table above!
Yet consumer confidence is down. As evidenced by retail sales.
Floating Path Dot Com
The U.S. Census Bureau reports that retail sales decreased a seasonally adjusted -0.4% in March to $418.3 billion. This follows a +1.0% increase in February, and is the largest monthly decrease since June of 2012.

Reuters / University of Michigan report in the preliminary reading for April consumer sentiment that the index decreased to 72.3. This compares to a 78.6 reading in March, and continues what has been a very inconsistent trend of ups and downs.

We noticed a deep dip in confidence in what appears a as (non recession period) 2011. Recession periods appear in highlighted blue. What you wager that is the affect of the 2011 budget crisis in which Boehner got “98% of what he wanted” and the US Credit rating was reduced?
___________________

The AP reports:
The Labor Department said Friday that the unemployment rate rose to 7.3 percent from 7.2 percent in September, likely because furloughed federal workers were counted as unemployed. The report noted that the shutdown did not affect total jobs.Employers also added 60,000 more jobs in the previous two months than earlier estimated.The figures show hiring has picked up in the fall. Employers added an average of 202,000 jobs from August through October, up from 146,000 from May through July.Stock futures fell after the report was released at 8:30 a.m. EDT, and the yield on the 10-year Treasury note rose. That suggests investors are worried that the better job numbers will prompt the Federal Reserve to pull back on its stimulus efforts sooner than expected.One troubling detail in the report: the percentage of Americans working or looking for work fell to a fresh 35-year low. But that figure was likely distorted by the shutdown, too.About 800,000 government workers were furloughed for all or part of the shutdown, which lasted from Oct. 1 through Oct. 16. Many were counted as unemployed and on temporary layoff for purposes of the unemployment rate.But the furloughed workers were still counted as employed by the government’s survey that counts jobs because they were ultimately paid for their time off. Federal government jobs fell only 12,000 last month.Some reports have hinted that hiring was improving. Retail stores, shipping companies, and other services firms stepped up hiring in October, according to private survey of service firms.And the number of people seeking unemployment benefits has fallen back to pre-recession levels after four weeks of declines. Unemployment benefit applications are a proxy for layoffs. The steady decline suggests companies are cutting fewer jobs.Economic growth accelerated in the July-September quarter to an annual rate of 2.8 percent, the government said Thursday. That’s up from 2.5 percent in the April-June quarter.But greater restocking by businesses drove much of the increase, a trend that may not be sustainable. Consumers and businesses both cut back on spending over the summer.
As the AP went to print, stock futures showed a stock futures prospect that was not born-out over the course of Friday November 8th.
T Rowe Price
| U.S. Stocks | |||
| Index2 | Friday’s Close | Week’s Change | % Change Year-to-Date |
| DJIA | 15761.78 | 146.23 | 20.28% |
| S&P 500 | 1770.61 | 8.97 | 24.15% |
| NASDAQ Composite | 3919.23 | -2.81 | 29.80% |
| S&P MidCap 400 | 1284.48 | -7.03 | 25.88% |
| Russell 2000 | 1099.06 | 2.23 | 29.40% |
Our insertion of the T Rowe chart was not in any way aimed at snipping at the AP. Press deadlines often force such before market open suppositions. Fortunately, the AP’s professionals left the comment stand as a comment before the markets open on Friday.
As we fold the Pew Research into our minds and archives we reflect on a Daily Kos piece related to the US economy.
As we fold the Pew Research into our minds and archives we reflect on a Daily Kos piece related to the US economy.
In September 2012, The Daily Kos published a piece related to which political party has best managed the US economy. The results are “slam-dunk” Democrat Administrations win out.
While the U.S. recovery from the crippling Bush recession has been painfully slow, most economists–including the nonpartisan CBO and some of John McCain’s own 2008 advisers–believe President Obama saved the American free-enterprise system from the abyss. And many economists are increasingly worried that businessman-turned-President Romney would lead the United States back into recession.
Here’s why the economic debate between Democrats and Republicans is no contest at all. (Click a link below for the details on each.)
Here’s why the economic debate between Democrats and Republicans is no contest at all. (Click a link below for the details on each.)
Job Creation and Economic Growth
The Stock Market
Income Inequality
National Debt
The Bush Disaster and the Obama Recovery
Looking Ahead to the Romney-Ryan Recession
The Pew Data is as it stands. We wonder, however, about the survey tool and whether the tool “force responded” people into manageable response categories that may not truly represent the extent to which the economy is viewed by the greater population. The impact of the NSA/CIA monitoring probably factors into any consideration of the Obama Administration for continuation of monitoring practices from the Bush years.
When all is stated and assimilated we are probably influence by the memory of the horrors of 2008/2009. A horror that is re-enforced by the fact the GOP will simply clone economic policy and administration of Bush and his economic team (and that is pursue supply side economics). Our horror turns into mortification as we consider many of those independents in the survey pool may have voted twice for George W. Bush.
Keystone XL Pipeline: Corporate Monument To The Power Of Business Over Rational Thought
In Gallup, Rasmussen on September 8, 2013 at 2:00 AM

On June 6, 2013 Forbes reported Harris polling found 82% of Americans (respondents) felt the Keystone XL Pipeline was good for national interest. Harris, according to Nate Silver’s Fivethirtyeight (538) web page, does not fair well when compared to much more reliable polling authorities. During the summer of the 2012 Presidential Campaign, Attackdemocrat Dot Com published a screed, which places the credibility of Harris polling into comparative focus. The piece from which the chart (below) was taken related to questions about May 2012 Attackdemocrat and Bloomberg reports of Obama leading Romney by 13 points. Of course, a cause for major alarm when people on the Right were greedily consuming poll results from Rasmussen and Gallup. Both of which practically declared an Obama loss as early as the early summer of 2012. Both also stuck with their flawed survey methodology and reporting well through the day of the fall General Elections. After the Obama landslide victory, Gallup promised to evaluate its methodology; Rasmussen simply sits waiting for the next opportunity to provide flawed survey data.
To be clear, the verbiage and chart are extractions from a screed that does not directly relate to Harris’s 82% Keystone results. We are posting the 2012 information for reference and perspective.
Excerpt…
If you are interested in how other polling organizations are ranked on Silver’s chart check out the chart below and a more complete chart at: http://www.fivethirtyeight.com/search/label/pollster%20ratings You may want to keep this chart handy as you read the results of various future polls.
The thing to look at is a pollster’s PIE. PIE is expressed as a positive number and reflects the amount of error that a pollster introduces above and beyond that which is unavoidable due to things like sampling variance. The lower a firm’s PIE the better.
Note: Selzer & Co. gets a PIE of 1.31, sixth from the best. That’s better than NBC/WSJ, AP-Gfk, Mason-Dixon, Pew, and Gallup.

|
According to the chart Harris ranks well into the lower third of noted polling authorities. One reason for the higher PIE rating is Harris’ polling methodology: Online surveys. PIE probably should be considered by media outlets as writers and editors publish survey data indicating 82% approval.
If the Nate Silver’s ratings, Attackdemocrat and PIE are credible (and they are very credible for me), can you see the danger?
Watch and listen carefully to an example of how flawed polling leads to misinformation and literal manipulation of the US public. Such data also feeds the greedy hoppers of US members of Congress who accept political contributions from Trans Canada via lobbyist.
|
The ultimate example is a 30 second Keystone XL Pipeline commercial running on national television. The “ad spot” is running on networks that appear to draw viewers seeking news related information(e.g. CNN, MSNBC and Fox).
Of course, you notice a few things. First, Harris’s “…82% good for the nation,” was included in the ad spot. Second, did you notice the ad agency’s clear avoidance of the word ‘pipeline!” Why? Could it be due to spills, breaks, mad-made disasters, contaminated environments or could use of the pipeline lead to what follows. Or, I should say what is to follow of ‘high information” people.
Propublica Pipeline Safety Tracker
Although they carry the vast majority of our oil and natural gas, the nation’s 2.5 million miles of pipelines remain largely invisible to the public. And while they’re much safer than alternatives such as trucks, pipelines suffer hundreds of ruptures and spills every year. Critics blame minimal oversight and old pipes for accidents that could have been prevented; operators maintain that they’re committed to continuous improvement. Here we map accidents that regulators labeled “significant incidents” from 1986 to the present. | Related Story »
Pipelines Explained: How Safe are America’s 2.5 Million Miles of Pipelines?
by Lena Groeger ProPublica, Nov. 15, 2012, 2:27 p.m.
At 6:11 p.m. on September 6, 2010, San Bruno, Calif. 911 received an urgent call. A gas station had just exploded and a fire with flames reaching 300 feet was raging through the neighborhood. The explosion was so large that residents suspected an airplane crash. But the real culprit was found underground: a ruptured pipeline spewing natural gas caused a blast that left behind a 72 foot long crater, killed eight people, and injured more than fifty.
Over 2,000 miles away in Michigan, workers were still cleaning up another pipeline accident, which spilled 840,000 gallons of crude oil into the Kalamazoo River in 2010. Estimated to cost $800 million, the accident is the most expensive pipeline spill in U.S. history.
Over the last few years a series of incidents have brought pipeline safety to national 2013 and presidential 2013 attention. As Obama begins his second term he will likely make a key decision on the controversial Keystone XL pipeline, a proposed pipeline extension to transport crude from Canada to the Gulf of Mexico.
The administration first delayed the permit for the pipeline on environmental grounds, but has left the door open to future proposals for Keystone’s northern route. Construction on the southern route is already underway, sparking fierce opposition from some landowners and environmentalists.
The problem, protesters say, is that any route will pose hazards to the public. While pipeline operator TransCanada has declared that Keystone will be the safest pipeline ever built in North America, critics are skeptical.
“It’s inevitable that as pipelines age, as they are exposed to the elements, eventually they are going to spill,” said Tony Iallonardo of the National Wildlife Federation. “They’re ticking time bombs.”
Critics of the Keystone proposal point to the hundreds of pipeline accidents that occur every year. They charge that system wide, antiquated pipes, minimal oversight and inadequate precautions put the public and the environment at increasing risk. Pipeline operators point to billions of dollars spent on new technologies and a gradual improvement over the last two decades as proof of their commitment to safety.
Pipelines are generally regarded as a safe way to transport fuel, a far better alternative to tanker trucks or freight trains. The risks inherent in transporting fuel through pipelines are analogous to the risks inherent in traveling by airplane. Airplanes are safer than cars, which kill about 70 times as many people a year (highway accidents killed about 33,000 people in 2010, while aviation accidents killed 472). But when an airplane crashes, it is much more deadly than any single car accident, demands much more attention, and initiates large investigations to determine precisely what went wrong.
The same holds true for pipelines. Based on fatality statistics from 2005 through 2009, oil pipelines are roughly 70 times as safe as trucks, which killed four times as many people during those years, despite transporting only a tiny fraction of fuel shipments. But when a pipeline does fail, the consequences can be catastrophic (though typically less so than airplane accidents), with the very deadliest accidents garnering media attention and sometimes leading to a federal investigation.
While both air travel and pipelines are safer than their road alternatives, the analogy only extends so far. Airplanes are replaced routinely and older equipment is monitored regularly for airworthiness and replaced when it reaches its safety limits. Pipelines, on the other hand, can stay underground, carrying highly pressurized gas and oil for decades 2013 even up to a century and beyond. And while airplanes have strict and uniform regulations and safety protocols put forth by the Federal Aviation Administration, such a uniform set of standards does not exist for pipelines.
Critics maintain that while they’re relatively safe, pipelines should be safer. In many cases, critics argue, pipeline accidents could have been prevented with proper regulation from the government and increased safety measures by the industry. The 2.5 million miles of America’s pipelines suffer hundreds of leaks and ruptures every year, costing lives and money. As existing lines grow older, critics warn that the risk of accidents on those lines will only increase.
While states with the most pipeline mileage 2013 like Texas, California, and Louisiana 2013 also have the most incidents, breaks occur throughout the far-flung network of pipelines. Winding under city streets and countryside, these lines stay invisible most of the time. Until they fail.
Since 1986, pipeline accidents have killed more than 500 people, injured over 4,000, and cost nearly seven billion dollars in property damages. Using government data, ProPublica has mapped thousands of these incidents in a new interactive news application, which provides detailed information about the cause and costs of reported incidents going back nearly three decades.
Pipelines break for many reasons 2013 from the slow deterioration of corrosion to equipment or weld failures to construction workers hitting pipes with their excavation equipment. Unforeseen natural disasters also lead to dozens of incidents a year. This year Hurricane Sandy wreaked havoc on the natural gas pipelines on New Jersey’s barrier islands. From Bay Head to Long Beach Island, falling trees, dislodged homes and flooding caused more than 1,600 pipeline leaks. All leaks have been brought under control and no one was harmed, according to a New Jersey Natural Gas spokeswoman. But the company was forced to shut down service to the region, leaving 28,000 people without gas, and it may be months before they get it back.
One of the biggest problems contributing to leaks and ruptures is pretty simple: pipelines are getting older. More than half of the nation’s pipelines are at least 50 years old. Last year in Allentown Pa., a natural gas pipeline exploded underneath a city street, killing five people who lived in the houses above and igniting a fire that damaged 50 buildings. The pipeline 2013 made of cast iron 2013 had been installed in 1928.
A fire rages through Allentown, PA, after a gas line explosion in Feb. 2011. Not all old pipelines are doomed to fail, but time is a big contributor to corrosion, a leading cause of pipeline failure. Corrosion has caused between 15 and 20 percent of all reported “significant incidents”, which is bureaucratic parlance for an incident that resulted in a death, injury or extensive property damage. That’s over 1,400 incidents since 1986.
Corrosion is also cited as a chief concern of opponents of the Keystone XL extension. The new pipeline would transport a type of crude called diluted bitumen, or “dilbit.” Keystone’s critics make the case that the chemical makeup of this heavier type of oil is much more corrosive than conventional oil, and over time could weaken the pipeline.
Operator TransCanada says that the Keystone XL pipeline will transport crude similar to what’s been piped into the U.S. for more than a decade, and that the new section of pipeline will be built and tested to meet all federal safety requirements. And in fact, none of the 14 spills that happened in the existing Keystone pipeline since 2010 were caused by corrosion, according to an investigation by the U.S. Department of State.
The specific effects of dilbit on pipelines 2013 and whether the heavy crude would actually lead to more accidents 2013 is not definitively understood by scientists. The National Academies of Science is currently in the middle of study on dilbit and pipeline corrosion, due out by next year. In the meantime, TransCanada has already begun construction of the southern portion of the line, but has no assurance it will get a permit from the Obama administration to build the northern section. (NPR has a detailed map of the existing and proposed routes.)
Little Government Regulation for Thousands of Miles While a slew of federal and state agencies oversee some aspect of America’s pipelines, the bulk of government monitoring and enforcement falls to a small agency within the Department of Transportation called the Pipeline and Hazardous Materials Safety Administration 2013 pronounced “FIM-sa” by insiders. The agency only requires that seven percent of natural gas lines and 44 percent of all hazardous liquid lines be subject to their rigorous inspection criteria and inspected regularly. The rest of the regulated pipelines are still inspected, according to a PHMSA official, but less often.
The inconsistent rules and inspection regime come in part from a historical accident. In the 60’s and 70’s, two laws established a federal role in pipeline safety and set national rules for new pipelines. For example, operators were required to conduct more stringent testing to see whether pipes could withstand high pressures, and had to meet new specifications for how deep underground pipelines must be installed.
But the then-new rules mostly didn’t apply to pipelines already built 2013 such as the pipeline that exploded in San Bruno. That pipeline, which burst open along a defective seam weld, would never have passed modern high-pressure requirements according to a federal investigation. But because it was installed in 1956, it was never required to.
“No one wanted all the companies to dig up and retest their pipelines,” explained Carl Weimer, executive director of the Pipeline Safety Trust, a public charity that promotes fuel transportation safety. So older pipes were essentially grandfathered into less testing, he said.
A burned out car and charred remains of a home in San Bruno, C.A. after a pipeline explosion in Sept. 2010 Later reforms in the 1990’s mandated more testing for oil pipelines, and today PHMSA requires operators to test pipelines in “high consequence” areas, which include population centers or areas near drinking water. But many old pipelines in rural areas aren’t covered by the same strict regulations.
Some types of pipelines 2013 such as the “gathering” lines that connect wells to process facilities or larger transmission lines 2013 lack any PHMSA regulation at all. A GAO report estimates that of the roughly 230,000 miles of gathering lines, only 24,000 are federally regulated. Because many of these lines operate at lower pressures and generally go through remote areas, says the GAO, the government collects no data on ruptures or spills, and has no enforced standards for pipeline strength, welds, or underground depth on the vast majority of these pipes.
The problem, critics argue, is that today’s gathering lines no longer match their old description. Driven in part by the rising demands of hydraulic fracturing, operators have built thousands of miles of new lines to transport gas from fracked wells. Despite the fact that these lines are often just as wide as transmission lines (some up to 2 feet in diameter) and can operate under the same high pressures, they receive little oversight.
Operators use a risk-based system to maintain their pipelines 2013 instead of treating all pipelines equally, they focus safety efforts on the lines deemed most risky, and those that would cause the most harm if they failed. The problem is that each company use different criteria, so “it’s a nightmare for regulators,” Weimer said.
However, Andrew Black, the president of the Association of Oil Pipe Lines, a trade group whose members include pipeline operators, said that a one-size-fits-all approach would actually make pipelines less safe, because operators (not to mention pipelines) differ so widely.
“Different operators use different pipe components, using different construction techniques, carrying different materials over different terrains,” he said. Allowing operators to develop their own strategies for each pipeline is critical to properly maintaining its safety, he contended.
Limited Resources Leave Inspections to Industry Critics say that PHMSA lacks the resources to adequately monitor the millions of miles of pipelines over which it does have authority. The agency has funding for only 137 inspectors, and often employs even less than that (in 2010 the agency had 110 inspectors on staff). A Congressional Research Service report found a “long-term pattern of understaffing” in the agency’s pipeline safety program. According to the report, between 2001 and 2009 the agency reported a staffing shortfall of an average of 24 employees a year.
A New York Times investigation last year found that the agency is chronically short of inspectors because it just doesn’t have enough money to hire more, possibly due to competition from the pipeline companies themselves, who often hire away PHMSA inspectors for their corporate safety programs, according to the CRS.
Given the limitations of government money and personnel, it is often the industry that inspects its own pipelines. Although federal and state inspectors review paperwork and conduct audits, most on-site pipeline inspections are done by inspectors on the company’s dime.
The industry’s relationship with PHMSA may go further than inspections, critics say. The agency has adopted, at least in part, dozens of safety standards written by the oil and natural gas industry.
“This isn’t like the fox guarding the hen house,” said Weimer. “It’s like the fox designing the hen house.”
Operators point out that defining their own standards allows the inspection system to tap into real-world expertise. Adopted standards go through a rulemaking process that gives stakeholders and the public a chance to comment and suggest changes, according to the agency.
Questions have also been raised about the ties between agency officials and the companies they regulate. Before joining the agency in 2009, PHMSA administrator Cynthia Quarterman worked as a legal counsel for Enbridge Energy, the operator involved in the Kalamazoo River accident. But under her leadership, the agency has also brought a record number of enforcement cases against operators, and imposed the highest civil penalty in the agency’s history on the company she once represented.
Proposed Solutions Spark Debate How to adequately maintain the diversity of pipelines has proved to be a divisive issue 2013 critics arguing for more automatic tests and safety measures and companies pointing to the high cost of such additions.
One such measure is the widespread installation of automatic or remote-controlled shutoff valves, which can quickly stop the flow of gas or oil in an emergency. These valves could help avoid a situation like that after the Kalamazoo River spill, which took operators 17 hours from the initial rupture to find and manually shut off. Operators use these valves already on most new pipelines, but argue that replacing all valves would not be cost-effective and false alarms would unnecessarily shut down fuel supplies. The CRS estimates that even if automatic valves were only required on pipelines in highly populated areas, replacing manual valves with automatic ones could cost the industry hundreds of millions of dollars.
A worker on the Kalamazoo river, helping to clean up an oil spill of almost a million gallons from a ruptured pipeline in July 2010. Other measures focus on preventing leaks and ruptures in the first place. The industry already uses robotic devices called “smart pigs“ to crawl through a pipeline, clearing debris and taking measurements to detect any problems. But not all pipelines can accommodate smart pigs, and operators don’t routinely run the devices through every line.
Just last month, a smart pig detected a “small anomaly” in the existing Keystone pipeline, prompting TransCanada to shut down the entire line. Environmentalists pointed out that this is not the first time TransCananda has called for a shut down, and won’t be the last.
“The reason TransCanada needs to keep shutting down Keystone,” the director of the National Wildlife Federation contended in a statement, “is because pipelines are inherently dangerous.”
Last January, Obama signed a bill that commissioned several new studies to evaluate some of these proposed safety measures, although his decision on extending the Keystone pipeline may come long before those studies are completed.
Image credits: The Associated Press, Thomas Hawk, Kevin Martini
The Harris Survey with all of its flaws, contributes to manipulation that we suspect does not penetrate the skilled thinkers in the Obama Administration. However, we feel we are losing the Keystone Pipeline battle. We are losing because we doubt the Administration will be able to continue to fight off the onslaught of cash that accompanies pressure to approve. Cash focused on you and me (Commercial above) and directly available to cash greedy politicians who are speaking for approval.
More to Come on the Keystone XL Pipeline...
